Case study · Cruise Critic, a Tripadvisor company

My Cruise Planner

A planning workspace that turns scattered trip research into one clear plan.

My role
Product designer and researcher. Led product design from discovery through beta.
Team
2 PMs, lead engineer, engineers
Timeline
January – July 2026
Tools
Figma, Paper App, Claude, Vercel, Dscout

Cruisers plan big trips with little help from the tools they use. They juggle spreadsheets, screenshots, six to ten browser tabs, group texts, and cruise line apps. My Cruise Planner brings the whole trip into one place inside Cruise Critic.

The problem

The core insight: users act as unpaid project managers. This is a cognitive load problem, not a content gap.

What research showed

  • Cruisers built patchwork systems: spreadsheets, Word master sheets, five to twelve browser tabs, screenshots, email folders, Pinterest, Wanderlog, and AI chats.
  • No single tool covered the full trip, from booking to return.
  • Open tabs were the main way people compared options. Saved pages worked as a thinking tool.
  • Planners felt personal responsibility for everyone's happiness. The research named this the coordinator burden.
  • Over 57% of surveyed users used AI for planning. Many still preferred human advice, because trust mattered.

Biggest frustrations (January 2026 survey, 303 respondents)

Nothing in particular20.5%
Comparing itineraries16.6%
Coordinating flights and hotels12.7%
Too many options11.6%
Share of 303 respondents. Bar length is scaled to 25%.

My role

  • Led product design from discovery through beta.
  • Ran the July beta study and moderated sessions.
  • Presented designs at the April On Ramps and Activation workshop.
  • Owned the Figma and Claude prototypes.
  • Worked with two product leads, an epic owner, two developers, and internal reviewers. Handed off to a second designer in July.

Process

  • Discovery. Stakeholder interviews, surveys, user interviews, session reviews, a focus group, and market research.
  • Key insight. Users were doing unpaid project management. The real problem was mental load, not missing content.
  • Prototype testing. Usability tests on three prototype versions. The navigation test led to a hybrid design.
  • Internal testing. Team feedback showed users wanted automation and clearer labels.
  • Workshop. I presented designs to the cross-functional team and owned the Add Activity redesign.
  • Alpha and beta. Alpha QA, then moderated beta sessions with people planning real cruises.
  • V2 research. A survey, interviews, and community research produced 25 ranked problems and five priorities.

Key decisions

Navigation

Decision A hybrid design that combined the strongest parts of two options.

Options Three variants, tested with six users.

Why Option A read as cluttered. Testing showed which parts of each variant earned their place.

Add Activity redesign

Decision Clear labels for excursions, stays, and port parking, plus dropdowns instead of typed entries.

Options Keep the typed-entry flow, or rebuild it.

Why Testing called it the most frustrating interaction. I took the action item from the April workshop.

Pre- and post-cruise days

Decision Keep them, and highlight them.

Options Cut them to simplify the MVP.

Why Users found this unique and valuable. No other tool covered the full trip.

Checklist as safety net

Decision Group tasks by 90, 60, and 30 days before the cruise.

Why The checklist was the most loved feature. Grouping matched how planners already think about deadlines.

Naming system

Decision “My” names: My Cruises, My Itinerary, Planning Checklist.

Options “Trip Planning Guide”

Why Research said “Trip Planning Guide” was misleading. Plain names tested clearer.

Guest access

Decision Prompt on action, not on arrival.

Options Require sign-in up front.

Why Cuts signup friction. People commit after they see value, not before.

AI transparency

Decision AI content gets a clear source label, such as “Sourced from Cruise Critic Expert Reviews.”

Options Ship AI content unlabeled.

Why Beta showed a trust gap. Trust dropped when AI content had no source.

The final screens

The same planning flow works on desktop and on mobile web.
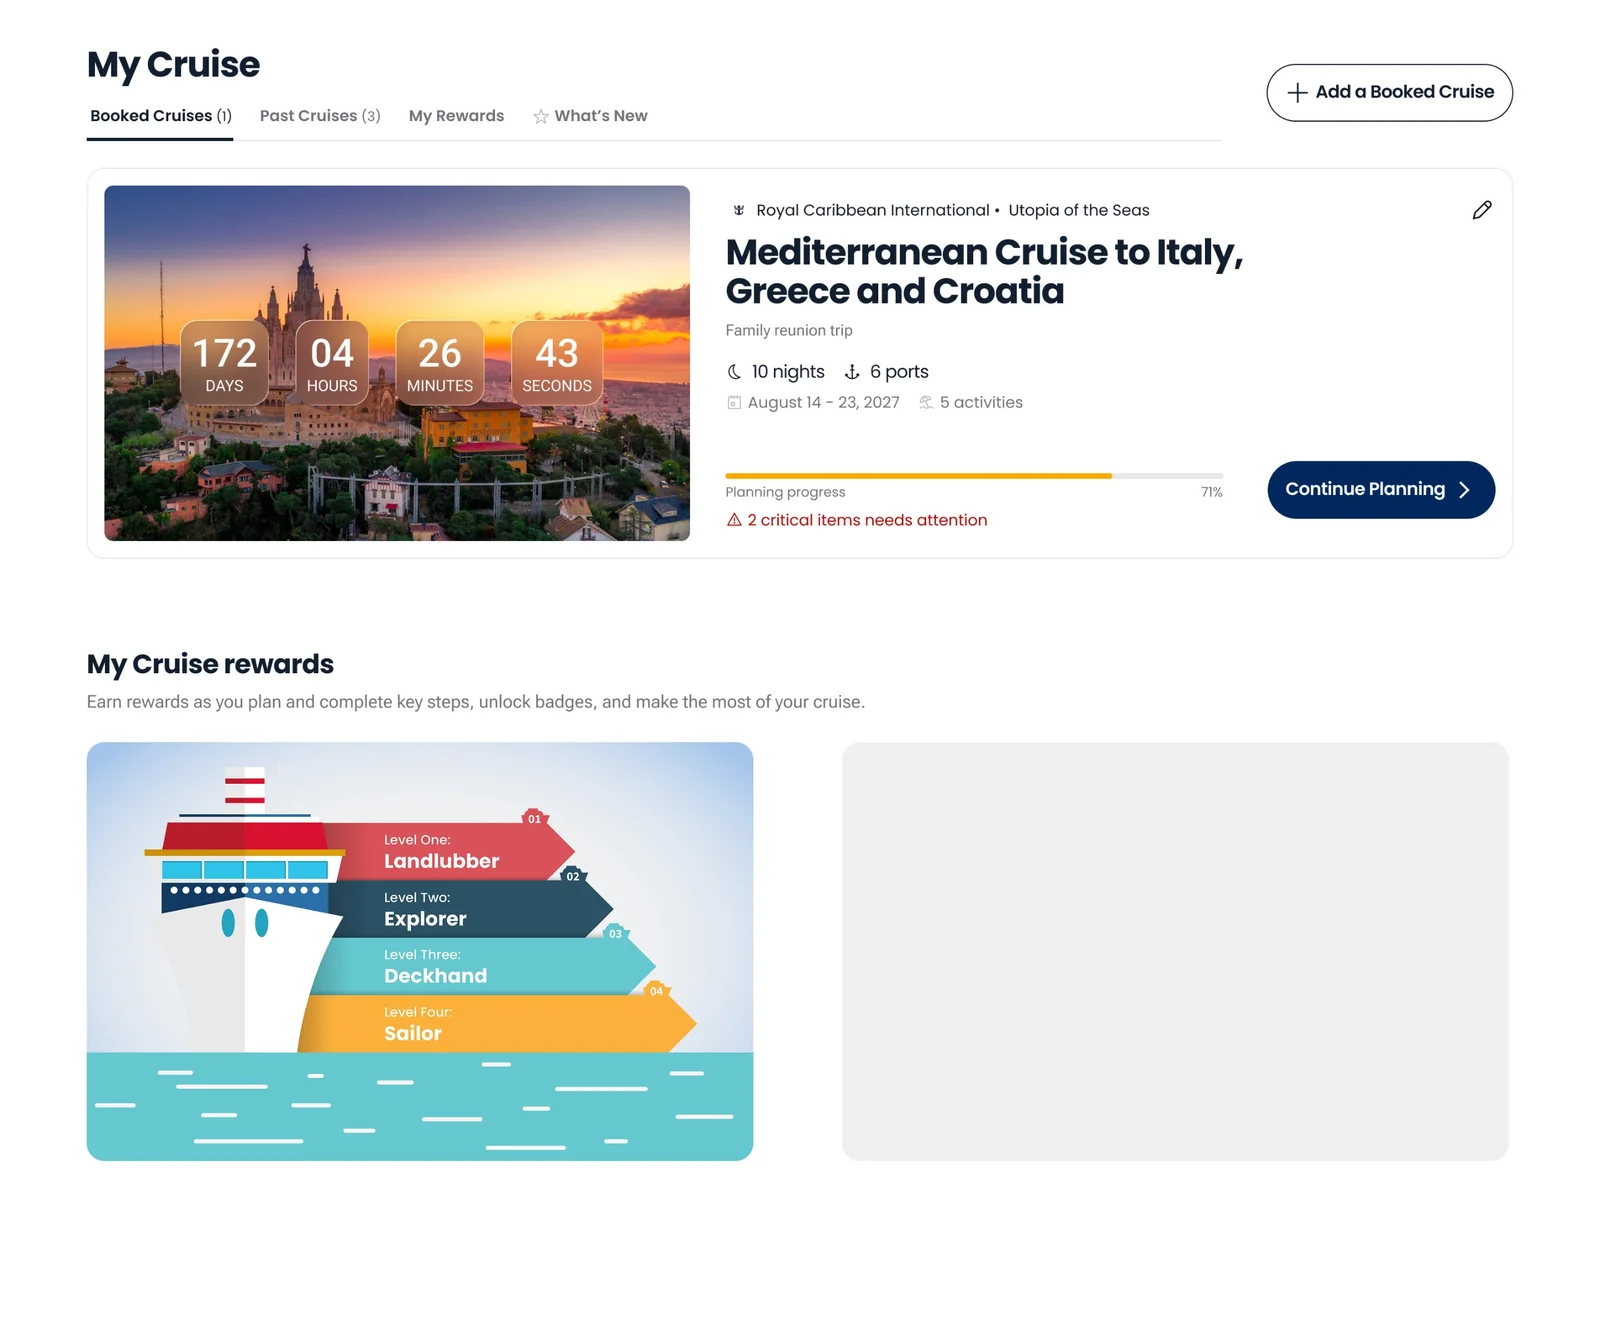
Desktop My Cruise dashboard with a countdown, a booked cruise card, planning progress, and a Continue Planning button
My Cruise dashboard on desktop.
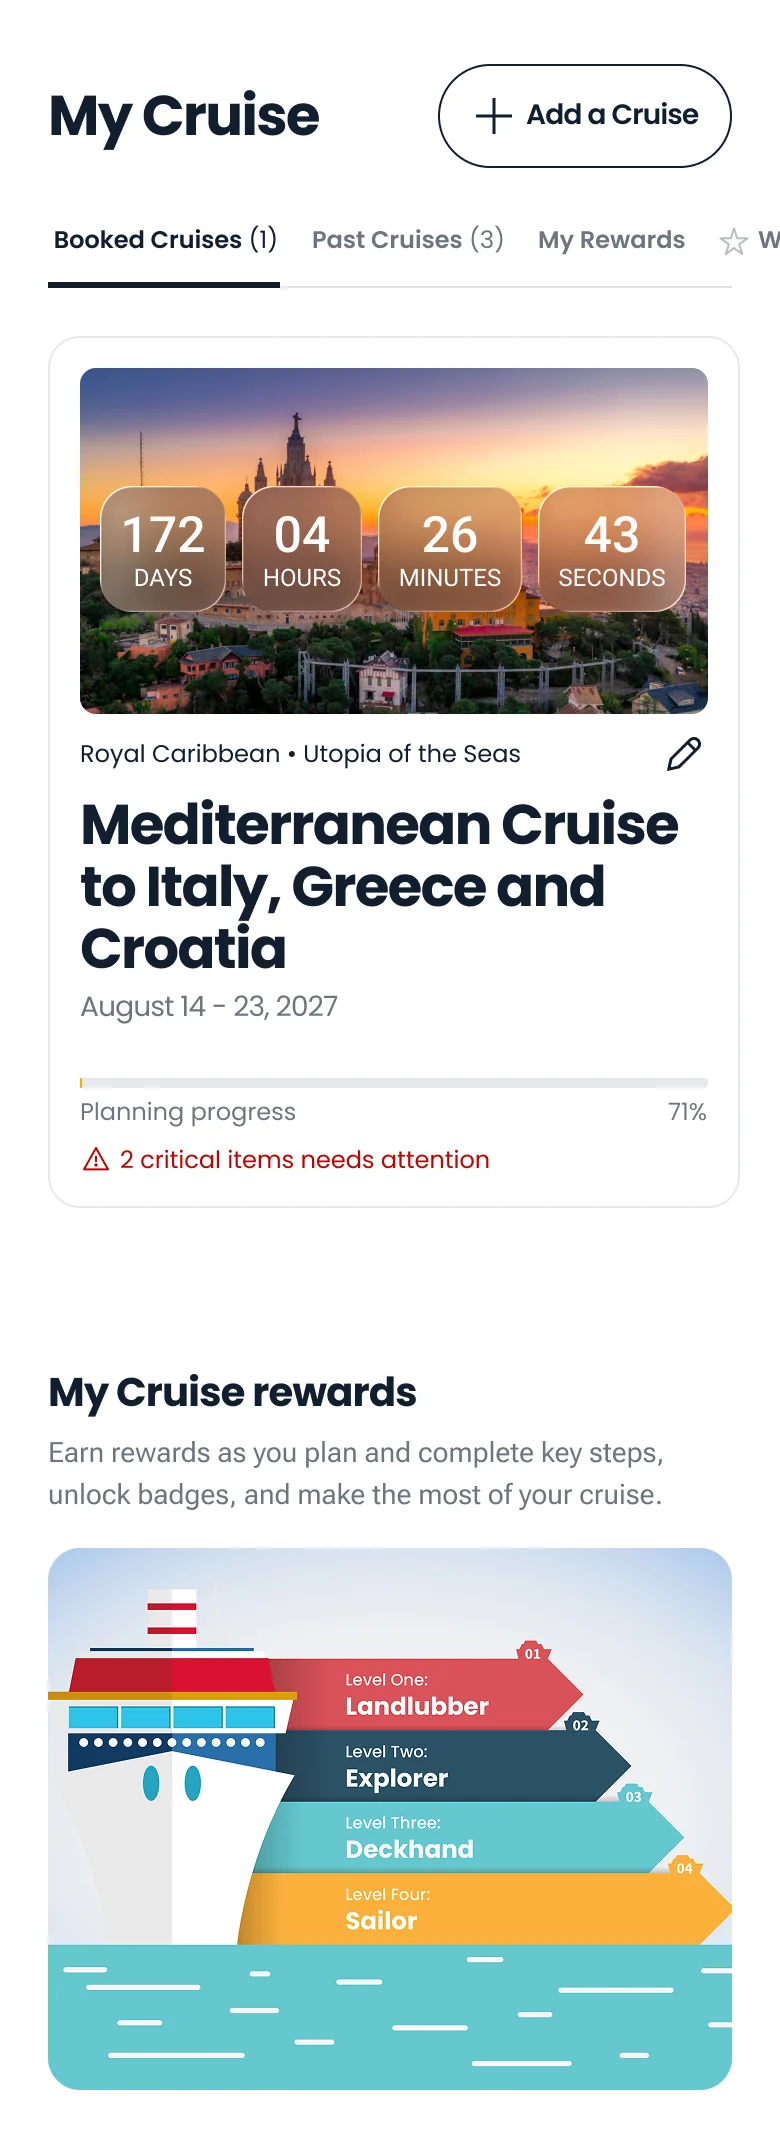
Mobile My Cruise dashboard with a countdown, a booked cruise card, and a rewards section
My Cruise dashboard on mobile web.
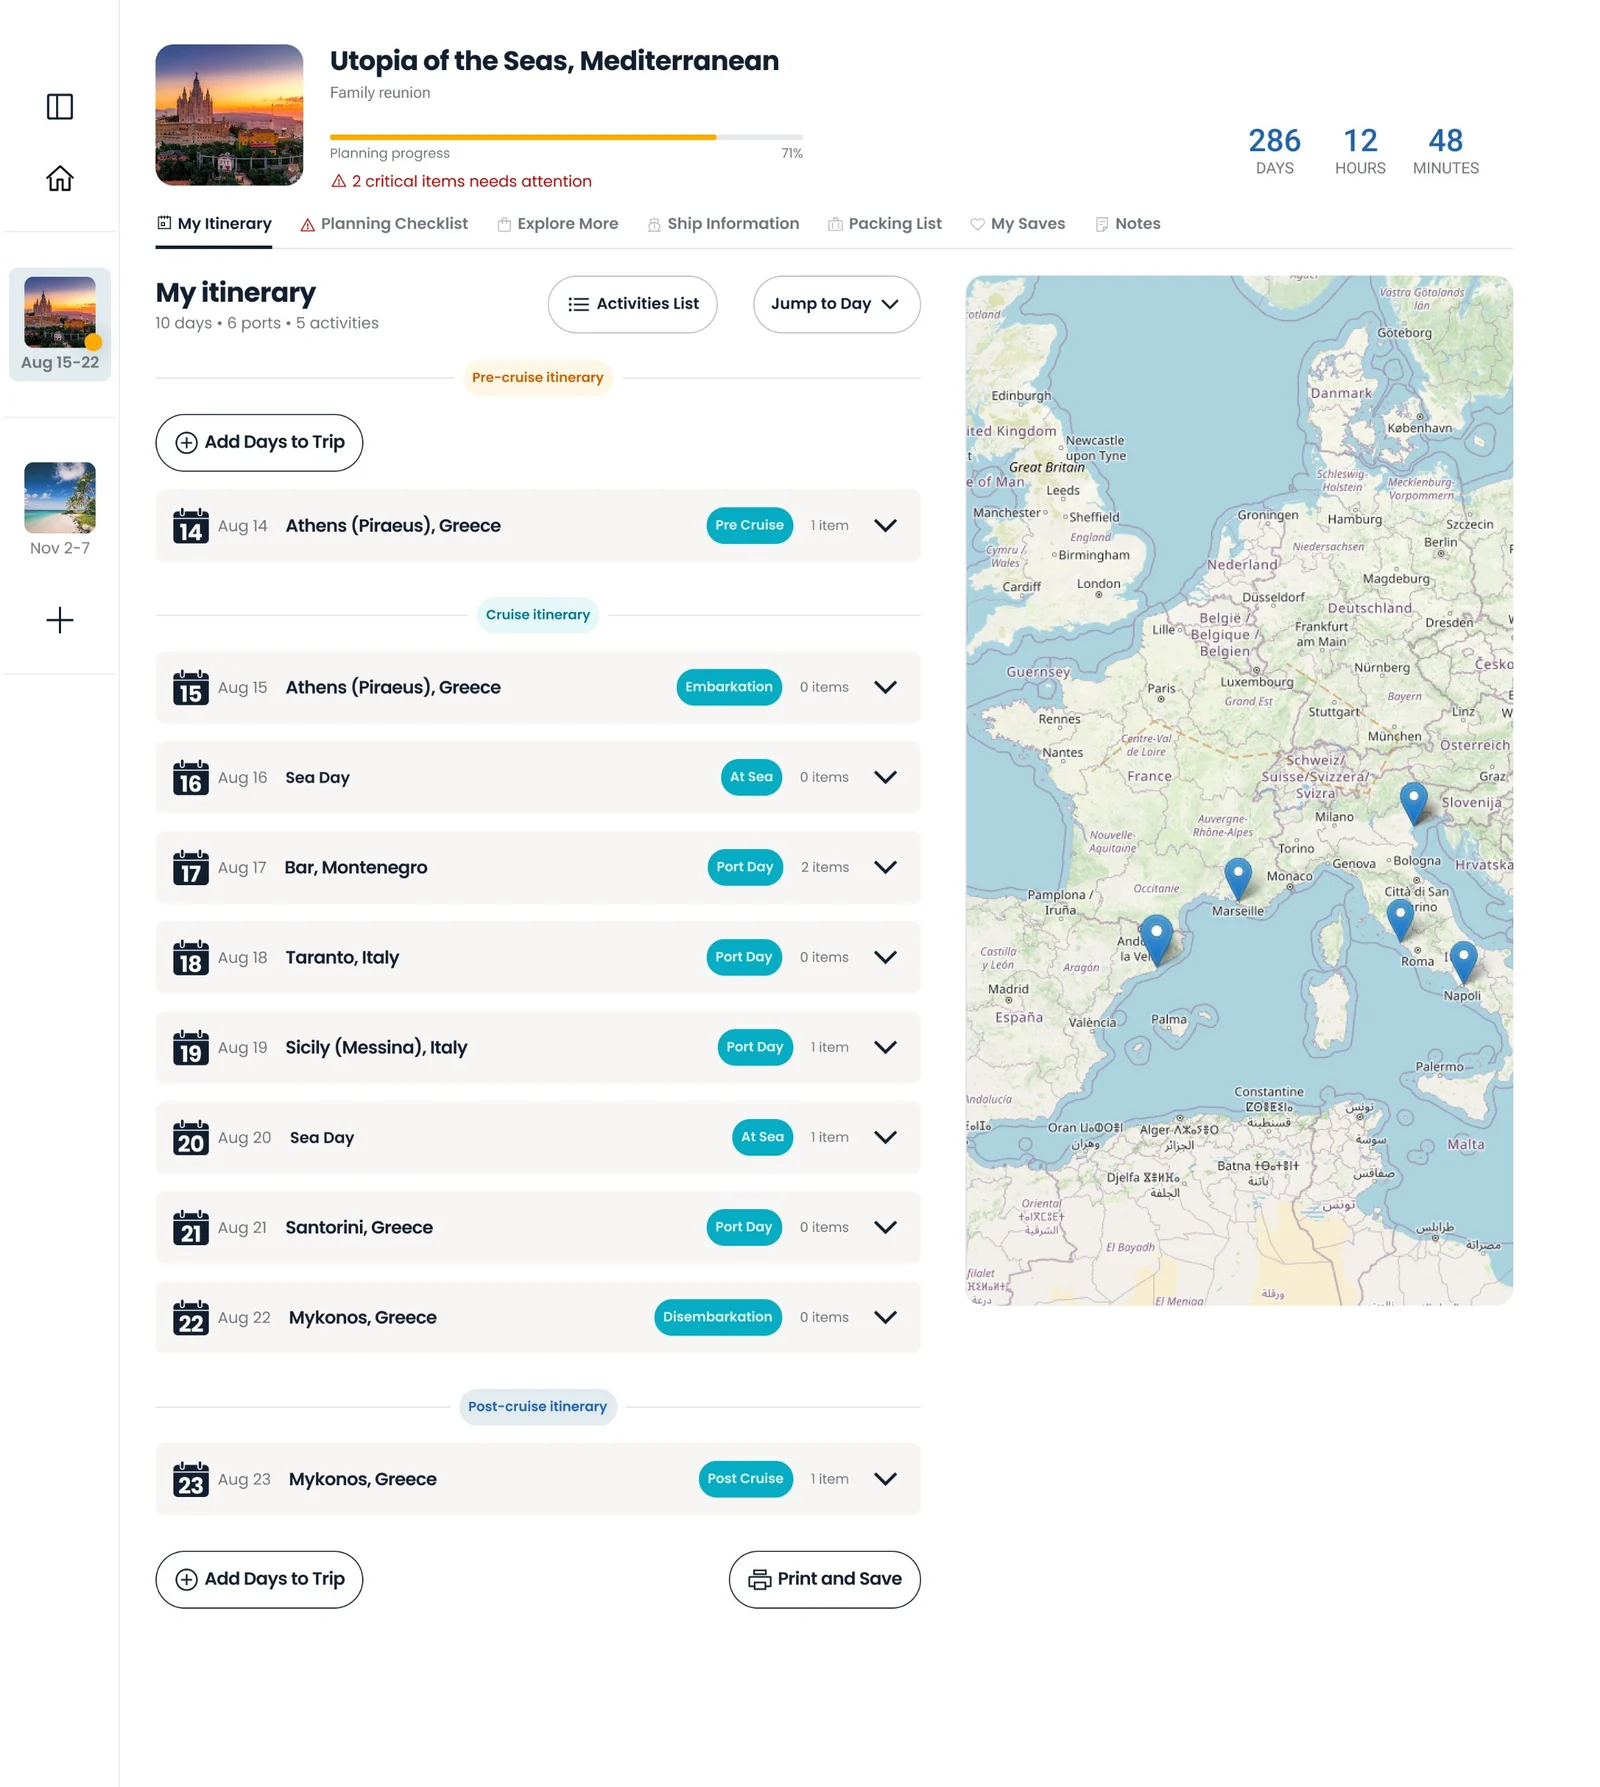
Desktop itinerary view with a day list, port tags, and a route map
Day-by-day itinerary with a route map on desktop.
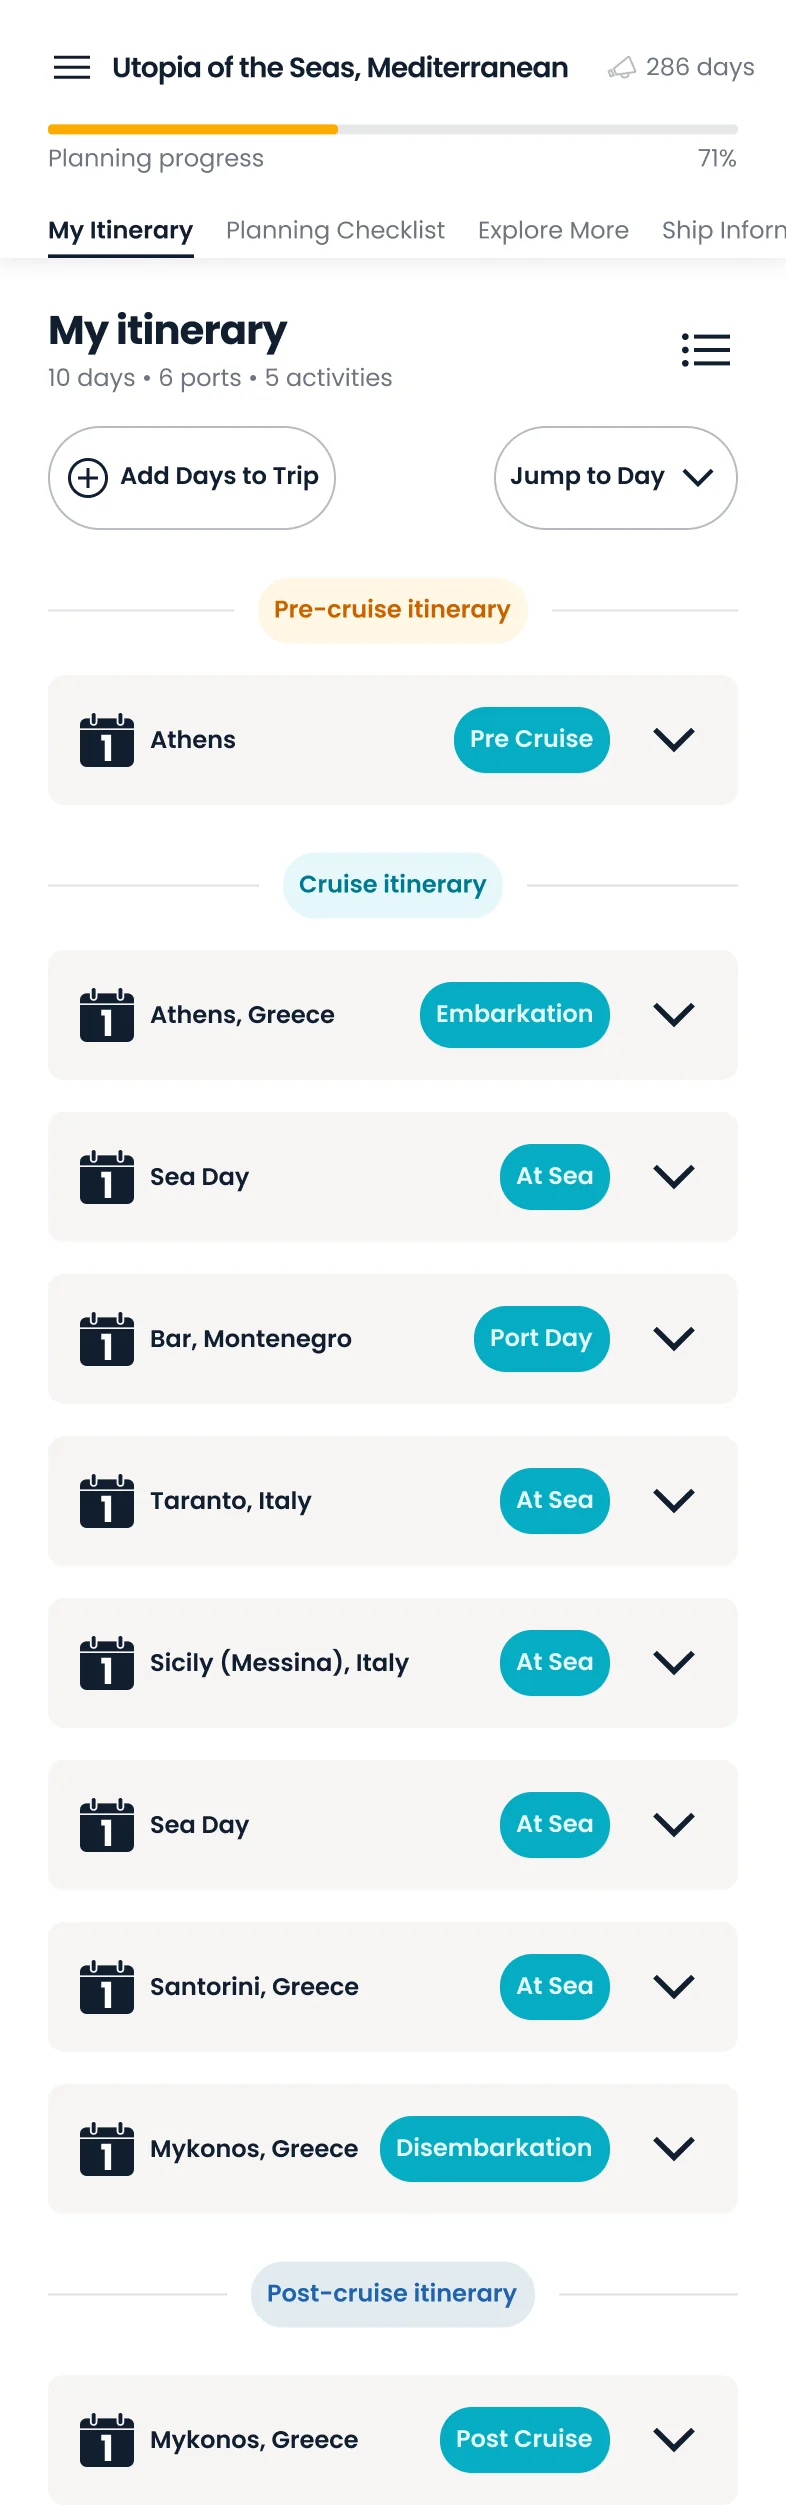
Mobile itinerary view with a stacked list of ports and sea days
Day-by-day itinerary on mobile web.
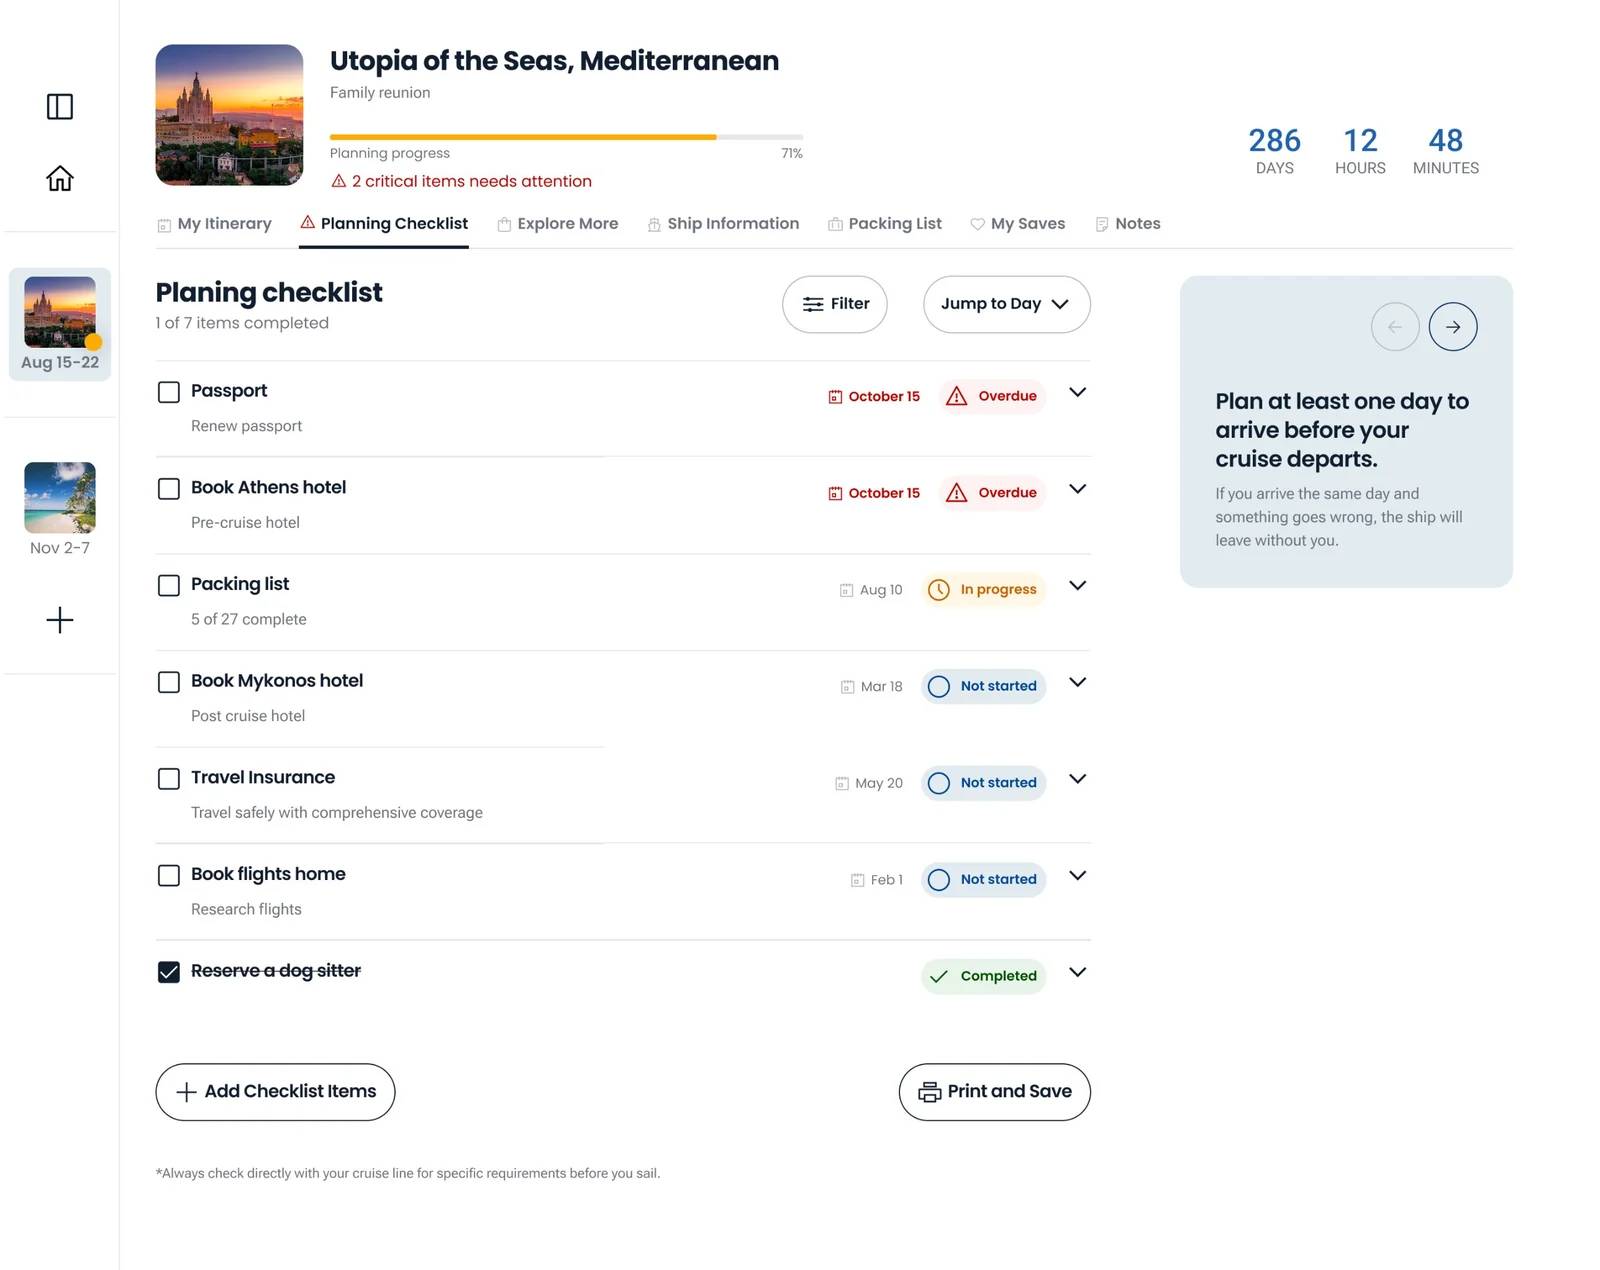
Desktop planning checklist with items, due dates, and status tags
Planning checklist on desktop.
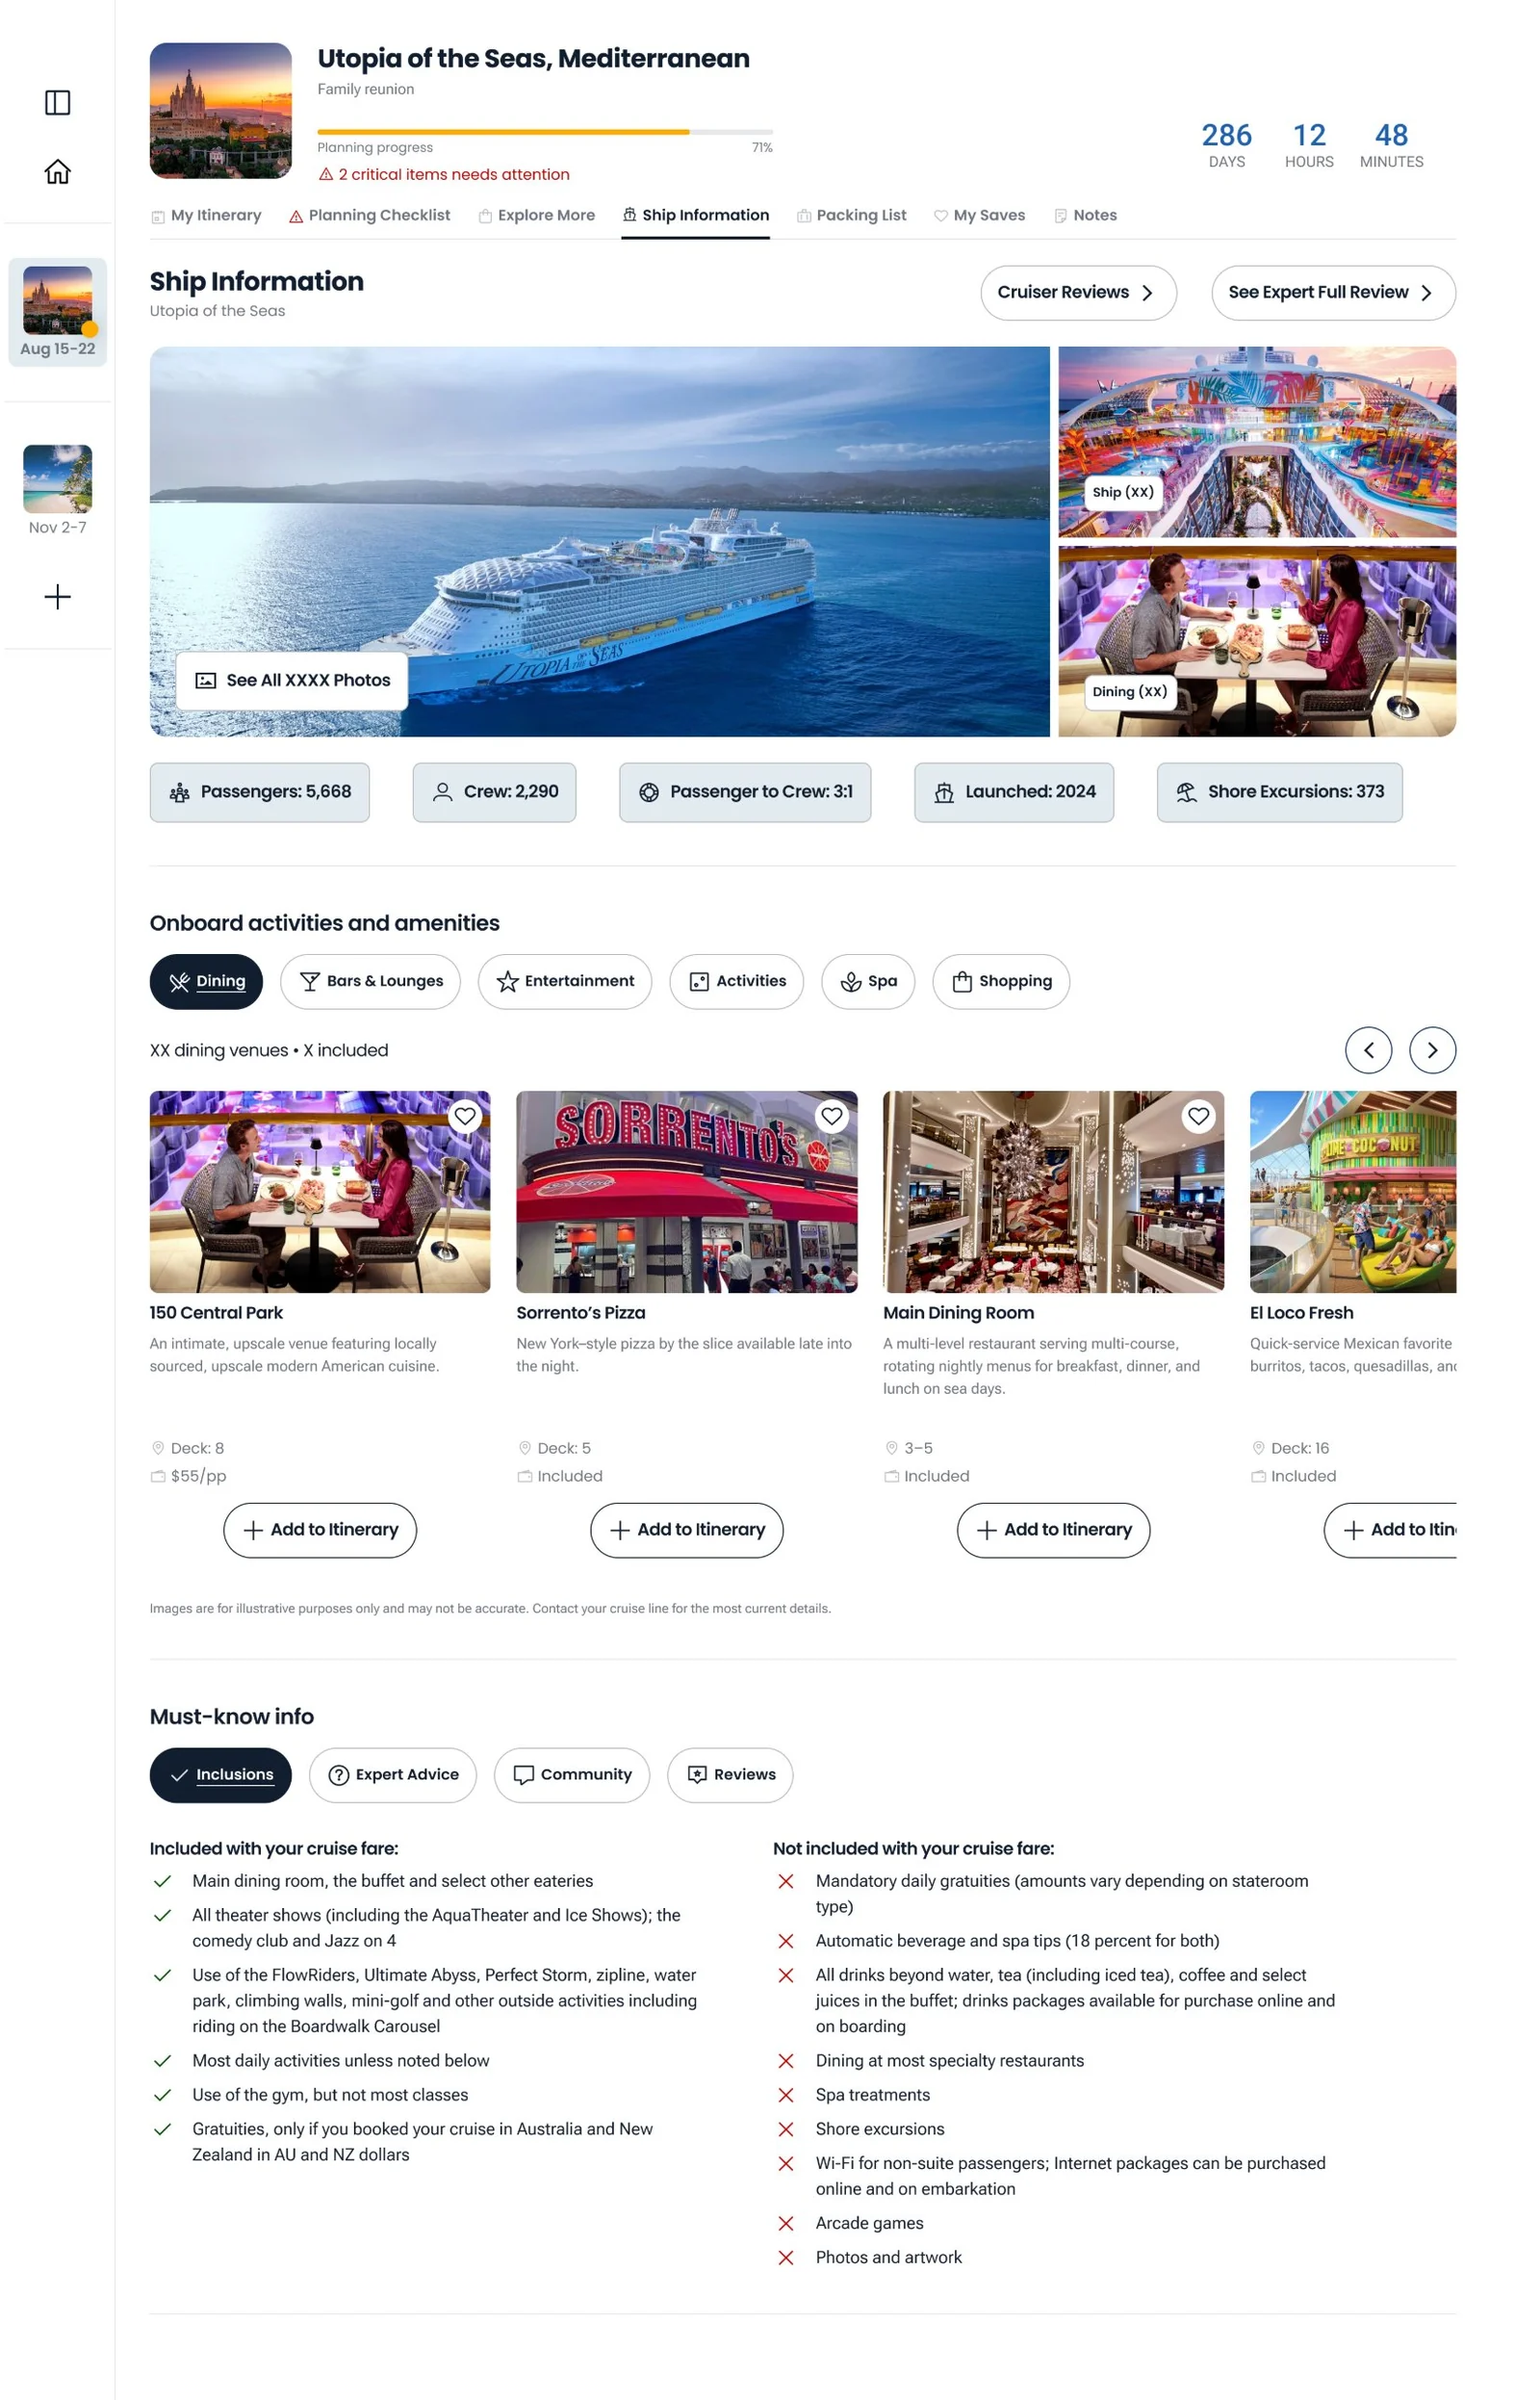
Desktop ship information page with ship photos, key facts, and onboard activities
Ship information on desktop.

Outcomes

What shipped: a day-by-day itinerary builder, a planning checklist with progress tracking, a packing list, ship information, trip notes, and print or save.

Changed by testing: hybrid navigation. Add Activity got dropdowns and clear labels. The content feed was cut.

10 of 10

beta participants understood the value without being told

8 of 10

said they would use it for their next cruise

1M+

monthly visitors on ship detail pages, where entry points live

“No more spreadsheets. That's perfect for me. I love that.”
Beta participant
“Design: Jamie Denke and Stephanie Thurber for making it warm, intuitive, and genuinely lovely to sail through.”
Jennifer Kuhn, Product Manager — V1 launch post, #cc-arrivals

Scores

Usability (out of 5)

Feature utility5
Navigation4
Visual clarity3
Information architecture3

Internal testing (out of 5)

Overall confidence4.38
Planning interaction (lowest)3.25
Planning interaction scored lowest, which showed the need for automation.
  • In beta, the progress bar and countdown were the top delighters.

Next to measure

  • Trip creation rate, and the share of trip creators who come back at least twice.
  • Feature use and planning depth (average items per itinerary).
  • Time to build a first itinerary. This tests the “less work” promise.

Lessons from the evidence

  • Check feature requests against data. The survey cut the MVP list and kept the product focused.
  • Watch for workarounds. Users pasting details into notes showed a gap in the product.
  • Label AI content from the start. Trust dropped when AI content had no source.
  • Test navigation before you commit. Three variants showed what was too heavy.